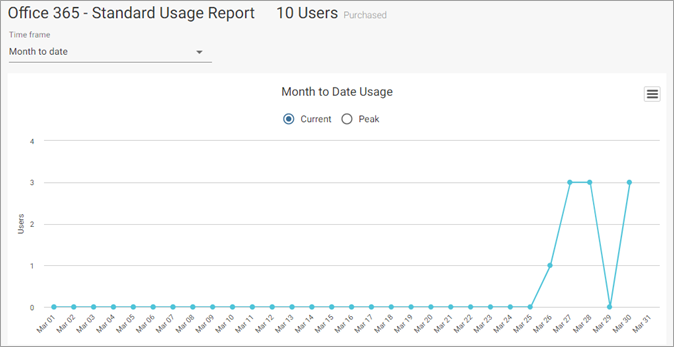
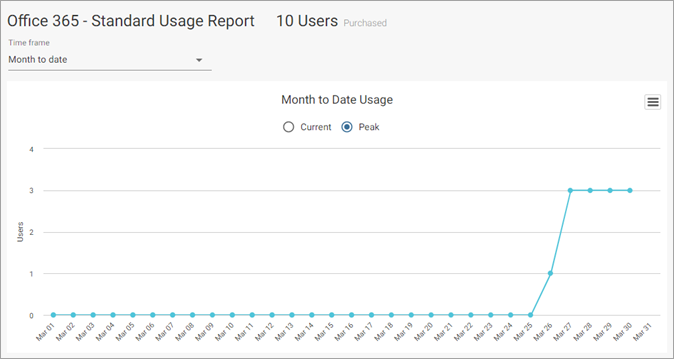
The Microsoft 365 - Standard Usage Report displays information about the number of unique Exchange and OneDrive users your company backed up during the indicated time period. SharePoint and Teams are not included in this report because they are counted only as capacity. You can view current usage for the current month and peak usage for the current month and the previous 3, 6, or 9 months.
Month to Date Usage Chart
-
Current: The Current view of the Month to Date Usage chart displays the exact number of unique Exchange and OneDrive users consuming the license as of the previous day. For example, if you view the chart on March 20, you can view data up to March 19.

-
Peak: The Peak view of the Month to Date Usage chart displays the largest number of unique Exchange and OneDrive users consuming the license up to the previous day.

Last 3 Months Peak Usage Chart
The Last 3 Months Peak Usage chart displays the largest number of unique Exchange and OneDrive users consuming the license over the past 3 months up to the previous day. For example, if you view the chart on March 20, you can view data for January, February, and March up to the 19th.
Last 6 Months Peak Usage Chart
The Last 6 Months Peak Usage chart displays the largest number of unique Exchange and OneDrive users consuming the license over the past 6 months up to the previous day. For example, if you view the chart on March 20, you can view data for January, February, and March up to the 19th.
Last 9 Months Peak Usage Chart
The Last 9 Months Peak Usage chart displays the largest number of unique Exchange and OneDrive users consuming the license over the past 9 months up to the previous day. For example, if you view the chart on March 20, you can view data for January, February, and March up to the 19th.
User Count Tiles
The totals in the user count tiles change based on the Time frame that you select at the top of the report.
-
Total Users: The total number of unique Exchange and OneDrive users that consumed the license during the selected time period up to the previous day. SharePoint and Teams are not included in this count because they are counted only as capacity.
-
Total Exchange Users: The total number of unique Exchange users that consumed the license during the selected time period up to the previous day. The following types of mailboxes are not counted users, but are counted as capacity: primary mailboxes, archive mailboxes, shared mailboxes, group mailboxes, public folder mailboxes, and team mailboxes.
-
Total OneDrive Users: The total number of unique users configured with OneDrive Quota (OneDrive storage is allocated) and a Microsoft O365 (OneDrive) License that consumed the license during the selected time period up to the previous day. OneDrive users without a Microsoft license are not counted as users, but are counted as capacity
Monthly Usage
The Monthly Usage table displays each unique Exchange and OneDrive user account (by email address) that consumed the license for the current month. SharePoint and Teams are not included in this count because they are counted only as capacity.

Optional: Configure any of the following options to filter or export the Monthly Usage data:
-
To hide columns, click the Column button
 , clear the columns that you want to hide, and then click Save.
 -
To export data, click the Export button
 , select the export file format, and then save the file to your local computer.
 -
To reload the chart so that it includes the most recent data, click Reload data
 .
.