The Global Command Center tenant administrator can access the Cost Overview Dashboard, which provides detailed cost and usage information categorized by offerings and by managed accounts.
Procedure
-
From the Global Command Center, click Dashboard.
The Company dashboard appears on the Company tab.
-
Click the Cost overview tab.
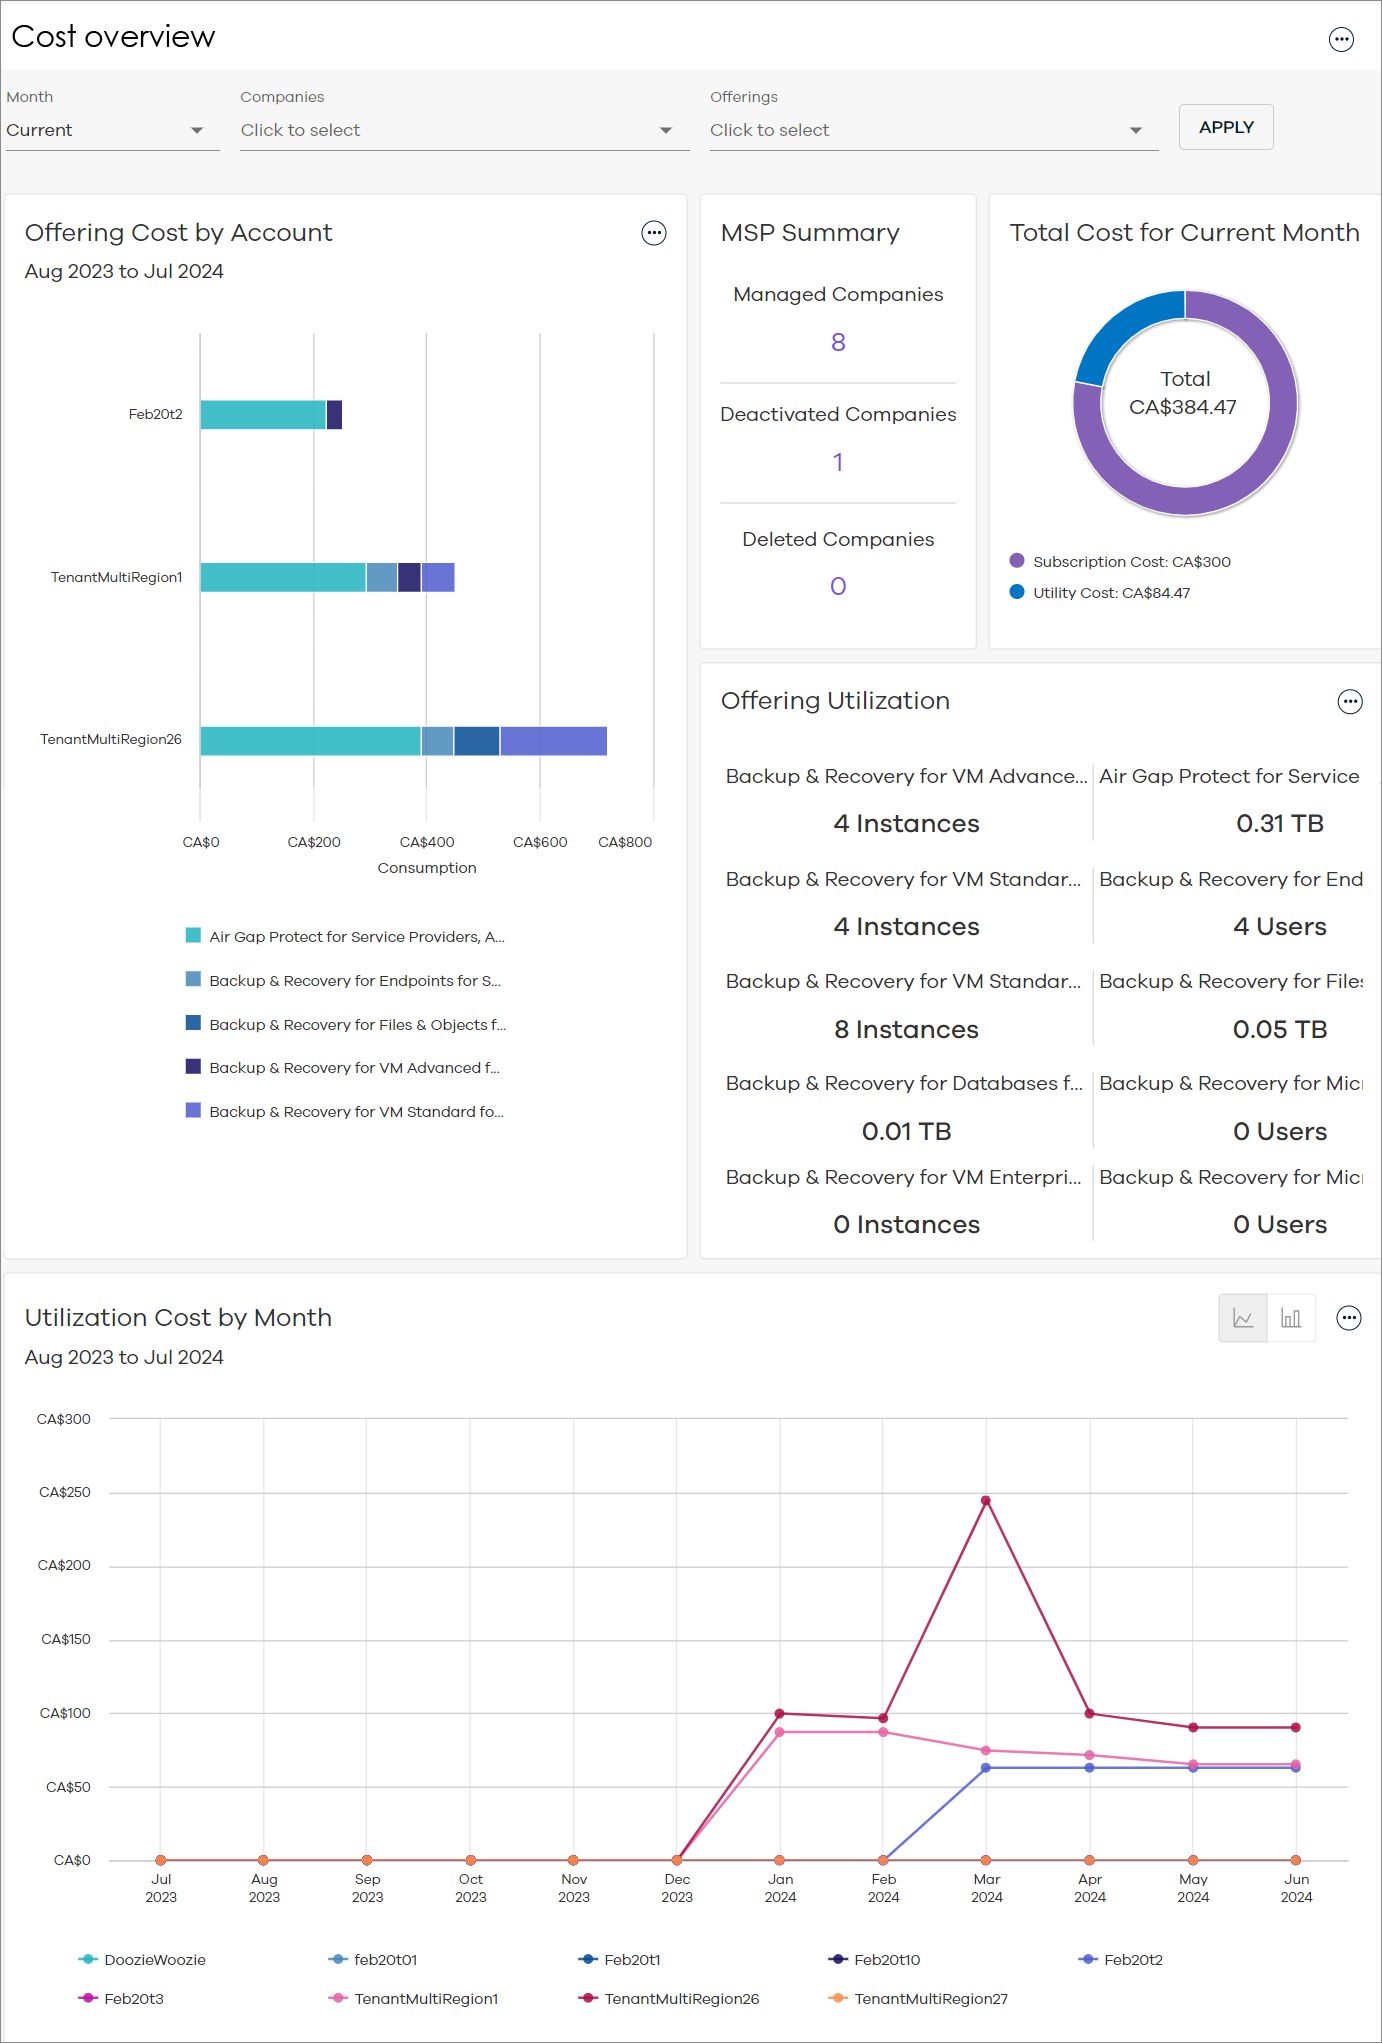
The Cost Overview Dashboard appears, as follows:
-
To refresh the dashboard according to specific datasets, do the following:
-
At the top of the dashboard, select from one of the following filters:
-
Month: Select a month.
-
Companies: Select one or more of your tenants.
-
Offerings: Select one or more offerings used by your tenants.
-
-
Click APPLY.
The dashboard refreshes based on your selections.
-
Dashboard Description
The following table includes descriptions for all the tiles on the Cost Overview Dashboard.
|
Tile |
Description |
|---|---|
|
Offering Cost by Account |
The costs per offering for your top 10 accounts, for the last 12 months leading up to the month that you selected in the Month filter. Mouse-over each segment of the bar chart to view costs per offering for each account. Click the action button - View in full screen: View the chart in full screen mode. - Display totals: Show cost totals in the chart. - Save as: Save chart as a PDF, or convert the chart data to an Excel spreadsheet (.xlsx). - Equivalent API: Copy the JSON payload. |
|
MSP Summary |
Number of actively managed companies, deactivated companies, and deleted companies. Click the numbers to view the companies that fall within each of these statuses. |
|
Total Cost for Month |
Your subscription cost and utility cost. |
|
Offering Utilization |
Utilization totals per service. Click the action button - Save as Excel: Convert the tile data to an Excel spreadsheet (.xlsx). |
|
Utilization Cost by Month |
Utilization costs for your accounts, for the last 12 months leading up to the month that you selected in the Month filter. Use the button Click the action button - View in full screen: View the chart in full screen mode. - Display totals: Show cost totals in the chart. - Save as: Save chart as a PDF, or convert the chart data to an Excel spreadsheet (.xlsx). - Equivalent API: Copy the JSON payload. |
 to select from the following options: