The Company Dashboard is a preview of the most critical information gathered from all tenant servers in your organization.
You can use the Company Dashboard to monitor tenant health and performance from a high level. Many tiles on the dashboard open detailed reports that you can use to analyze the displayed statistics.
Procedure
-
From the Global Command Center, click Dashboard.
The Company dashboard appears on the Company tab as follows:
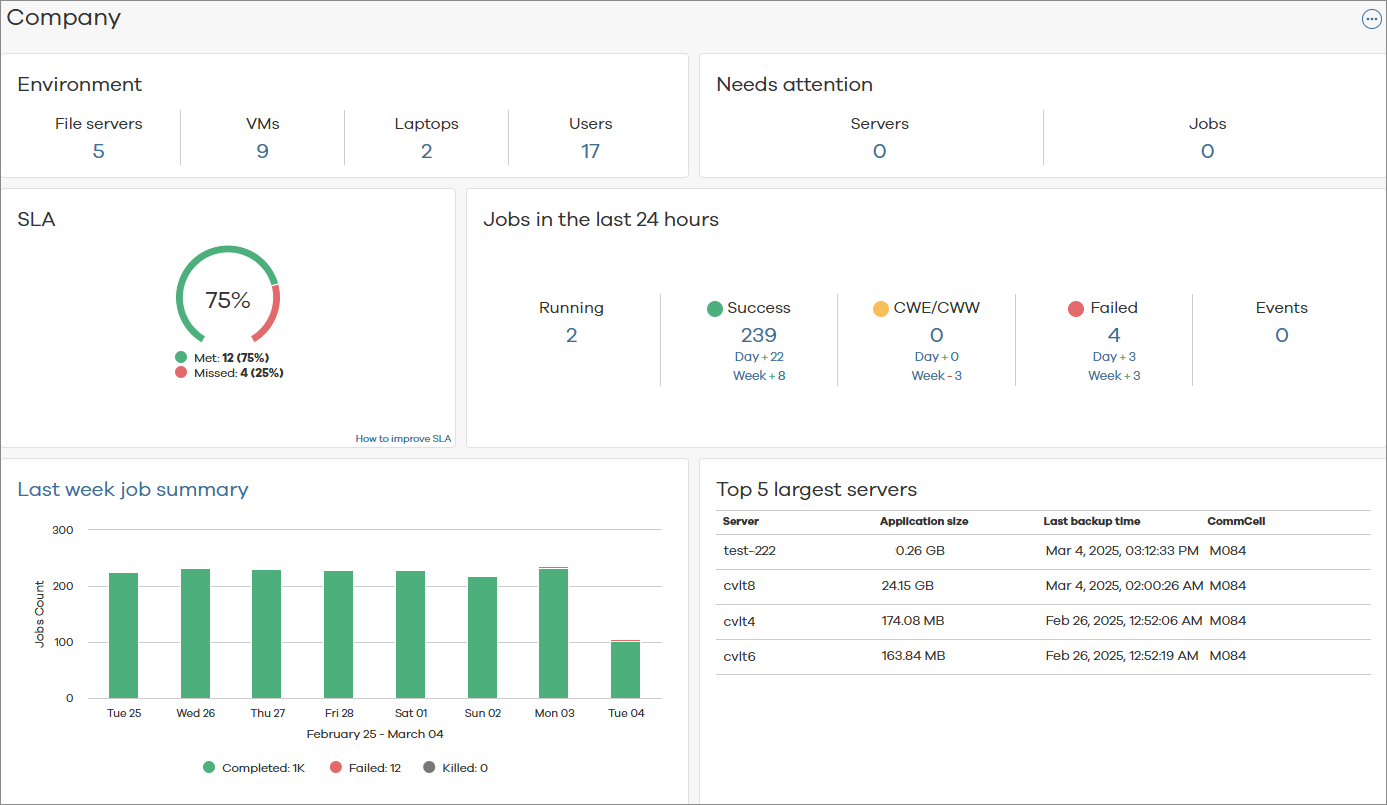
Dashboard Description
The following table includes descriptions for all the tiles on the Company Dashboard.
|
Tile |
Description |
|---|---|
|
Environment |
The number of entities — such as servers, VMs, laptops, and users - in the environment. To view more information for each of the entities on this tile, do the following:
|
|
Needs attention |
The number of entities and jobs that are flagged for anomalous behavior. To view more information for each of the entities or jobs on this tile, do the following:
|
|
SLA |
The percentage of all client computers that met or missed the service level agreement (SLA) that is configured for the environment. To view more information, do the following:
|
|
Jobs in the last 24 hours |
The number of jobs that are running, completed successfully, completed with errors/warnings, and failed, and the number of events related to those jobs in the previous 24 hours. To view more information for each of the sections on this tile, do the following:
|
|
Last week job summary |
The number of jobs that completed, completed with errors, failed, or were killed during each day in the last week. To view more information, do the following:
|
|
Top 5 largest servers |
The five largest servers in the environment, based on the total application size of every agent on the server. |