The Virtualization Dashboard is a preview of the most critical information gathered from all the virtualized servers and hypervisors in your organization.
You can use the Virtualization Dashboard to monitor the health and performance of all tenant servers across all regions. Many tiles on the dashboard open detailed reports that you can use to analyze the displayed statistics.
Procedure
-
From the Commvault MSP Portal, at the top of the page, click Manage All Accounts.
The Command Center appears.
-
Click Dashboard.
The dashboards appear.
-
Click the Virtualization tab.
The Virtualization dashboard appears as follows:
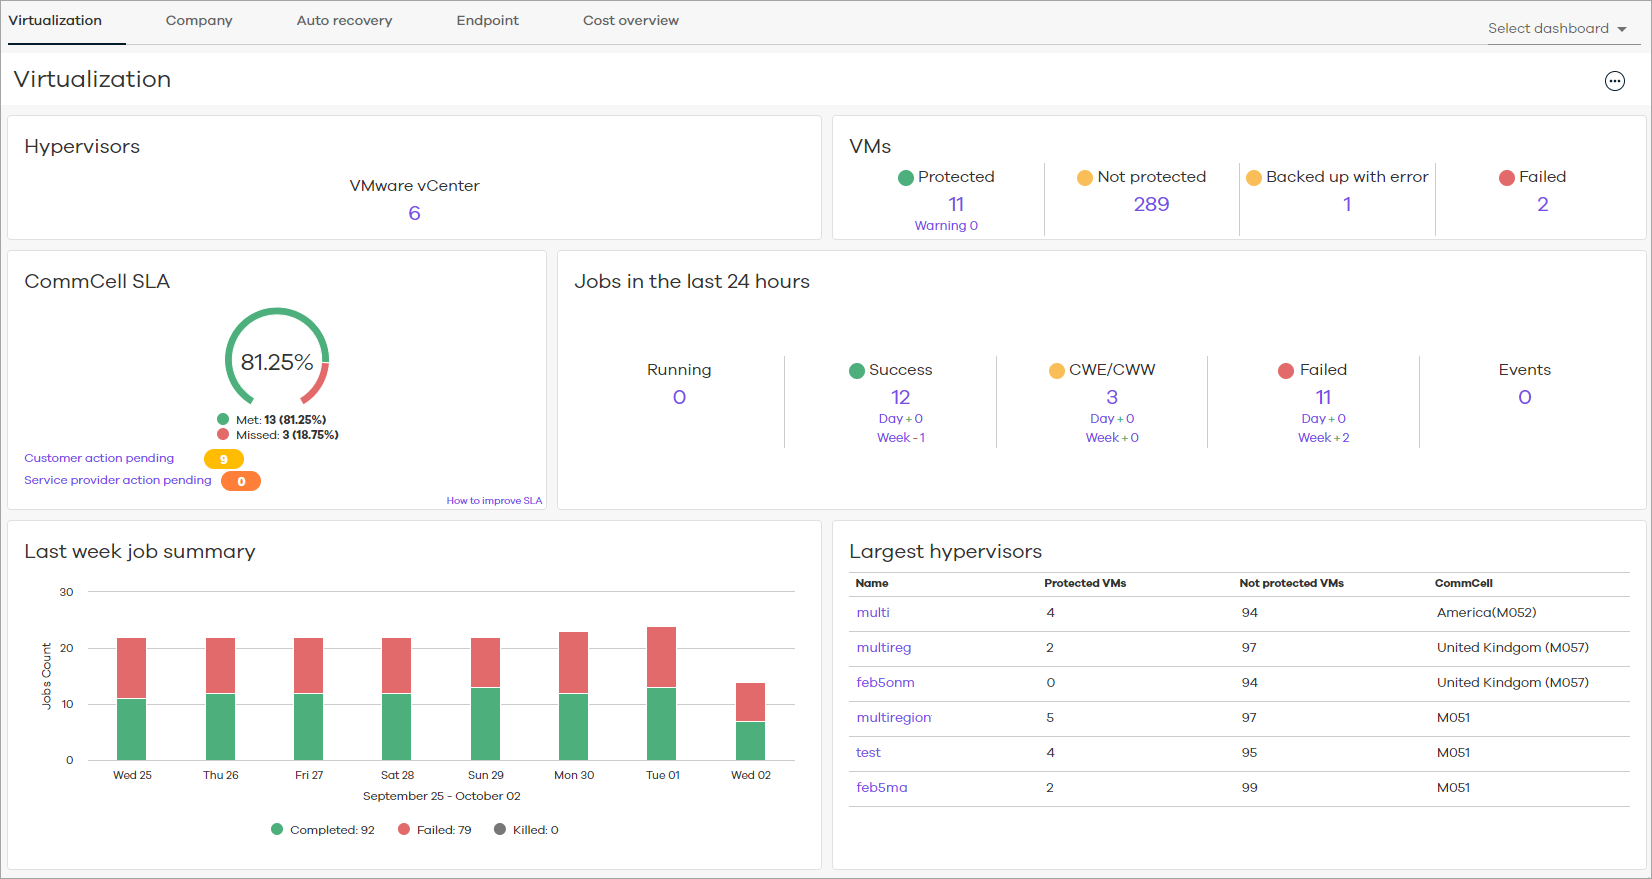
Dashboard Description
The following table includes descriptions for all the tiles on the Virtualization Dashboard.
|
Tile |
Description |
|---|---|
|
Hypervisors |
The number of VMs for each hypervisor type in the environment. To view more information for each of the entities on this tile, do the following:
|
|
VMs |
The number of virtual machines that are backed up, not backed up, or encountered errors during backup, as follows:
To view more information for each of the entities on this tile, do the following:
|
|
CommCell SLA |
The percentage of all client computers that met or missed the service level agreement (SLA) that is configured for the environment. To view more information, do the following:
|
|
Jobs in the last 24 hours |
The number of jobs that are running, completed successfully, completed with errors/warnings, and failed, and the number of events related to those jobs in the previous 24 hours. To view more information for each of the sections on this tile, do the following:
|
|
Last week job summary |
The number of jobs that completed, completed with errors, failed, or were killed during each day in the last week. To view more information, do the following:
|
|
Largest hypervisors |
The hypervisors that have the highest number of VMs in the environment, and the number of VMs that are backed up, and the number of VMs that are not backed up. To view more information, do the following:
|