HyperScale hardware is monitored to detect errors in the following components:
-
Disk Drives
-
Cache Disks
-
Power Supply
-
Fan
-
NIC (Network)
Dial Home for Hyperscale and Appliance Hardware Alert
The Dial Home for Hyperscale and Appliance Hardware Alert generates and sends a dial home (or call home) alert to the Administrator and hyperscalealerts@commvault.com when an error is detected in a disk drive, cache disk, power supply, fan, or NIC, or when any of these components goes offline in the underlying hardware. This alert is generated by default for all HyperScale Appliances.
If the Appliance is installed only as a MediaAgent, then you must download the HyperScale Hardware Monitoring alert from the Commvault Store. To download the alert, see HyperScale Hardware Alerts.
You must configure the alert to send notifications to the cloud and to the HyperScale Appliance support team. For instructions, see Configuring the HyperScale Hardware Monitoring Alert.
Additional Alerts
The following additional alerts are recommended to monitor your HyperScale entities. For more information about creating an alert, see Creating an Alert from the Alert Wizard.
-
Mount path Went Offline, Library Went Offline alerts
Enable these alerts to generate a notification when a mount path or library goes offline. For more information about these alerts, see Predefined Alert Criteria - Device Status.
-
MediaAgent went offline alert
Enable this alert to generate a notification when a MediaAgentgoes offline. For more information about this alert, see Predefined Alert Criteria - MediaAgents.
-
Insufficient storage alert
Enable this alert to generate a notification when there is insufficient disk space. For more information about this alert, see Predefined Alert Criteria - Library Management.
-
No DDB Space Reclamation from past N days alert
Enable the option to generate the No DDB Space Reclamation from past N days alert when a DDB space reclamation was not performed. For more information, see DDB Data Verification.
Command Center Views
Dashboard View
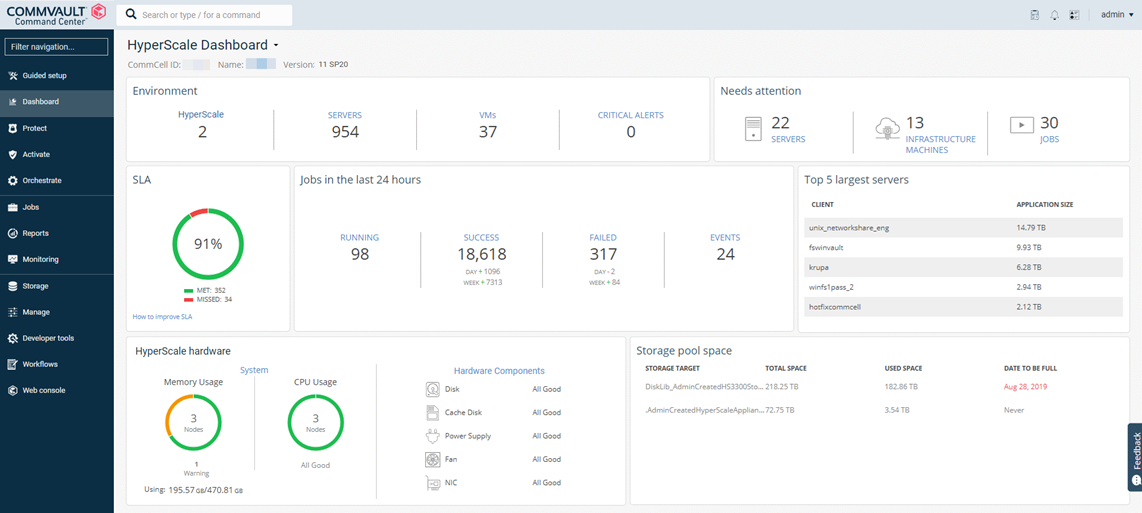
The status of the appliance, including hardware errors, can be viewed in the Command Center dashboard. This view can be used to quickly evaluate the health of the appliance.
Note
The HyperScale Dashboard appears as the initial view (or landing page) when you log on to the Command Center, if you have the necessary user permissions. For more information about dashboard visibility, see Dashboard Visibility by User.
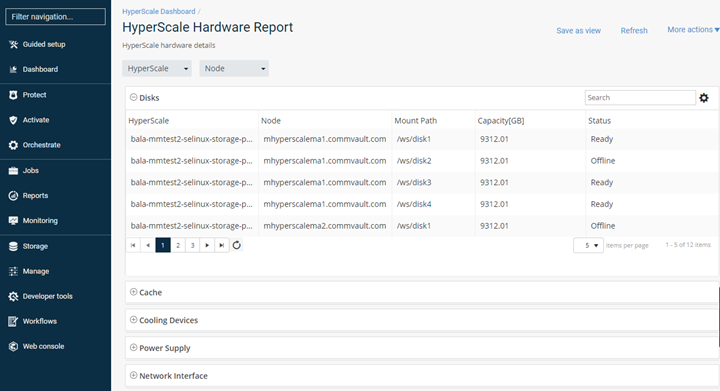
Detailed View
A detailed HyperScale Hardware Report can be viewed by clicking the Hardware Components from the Dashboard. Each hardware component (Disks, Cache, Cooling Devices, Power Supply, and Network Interface) provides a detailed view as sub-sections in this report. You can also filter the report information based on the storage pool and the node associated with the selected storage pool.
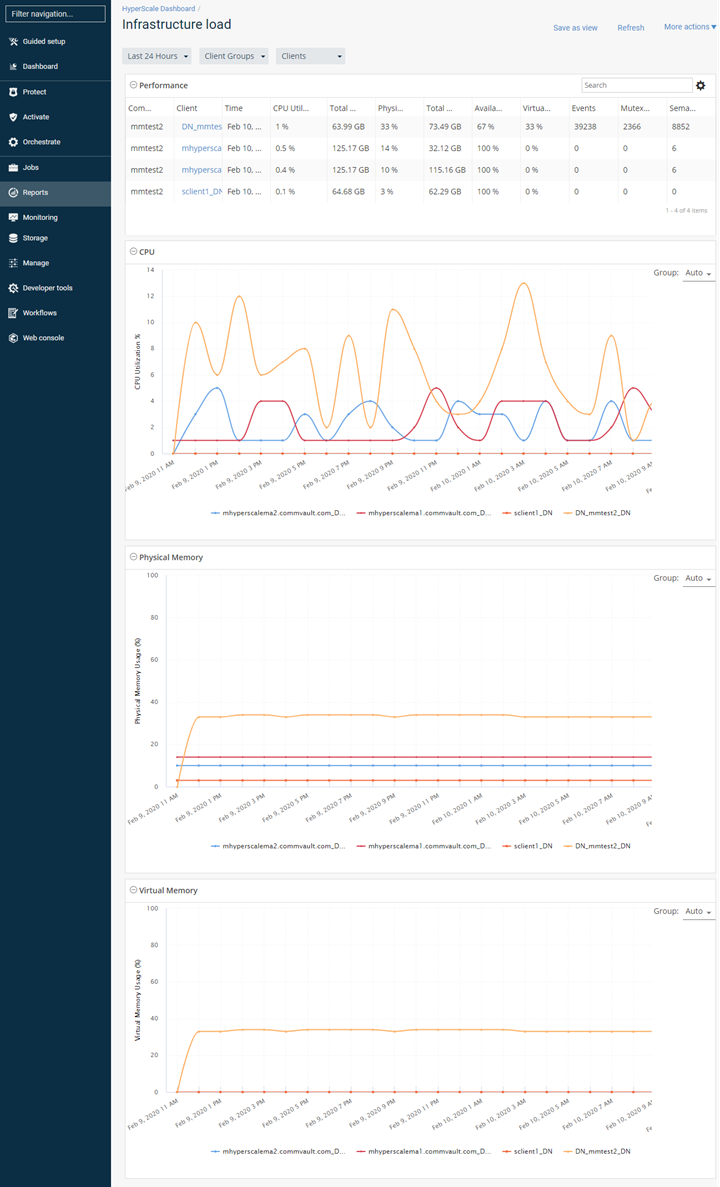
Infrastructure View
The Infrastructure Load view can be viewed by clicking System from the Dashboard. Performance-related information for each node is displayed in this view. In addition, the CPU performance, the amount of physical memory that was used, and the amount of virtual memory that was used also appears in charts.