You can add a line chart or timeline chart to display data changes over time.
Before You Begin
-
Review the options that are available for line charts and timeline charts:
Procedure
-
On the Web Console for the Private Metrics Reporting Server, click Reports.
The Worldwide Dashboard appears.
-
To open a report where you have already added a data set, from the navigation pane, click Configuration > Reports, and next to the Report Name under Actions, click Edit.
-
Optional: If your report has multiple pages, click the tab for the page that you want to edit.
-
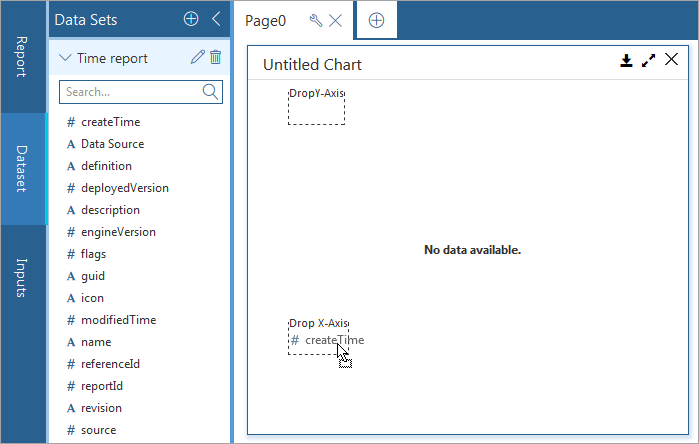
Drag Line Chart or Timeline Chart to the Drop components to build the report box.
-
From the Data Sets list, drag a field name to the Drop X-Axis box.
Timeline charts support only time stamp, date, and integer field types for the first field in the Drop X-Axis box. While integer field types are allowed, they are assumed to be UNIX timestamps in Coordinated Universal Time (UTC).
You can add alphabetic-type fields to the Drop X-Axis box as a secondary piece of information.
-
Configure the Drop Y-Axis box for line or timeline charts:
-
For line charts, if you want to graph something other than default, delete the Y-Axis selection, and from the Data Sets list, drag another field name to the Drop Y-Axis box.
-
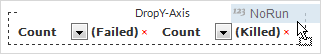
For timeline charts, from the Data Sets list, drag a field name to the Drop Y-Axis box.
-
-
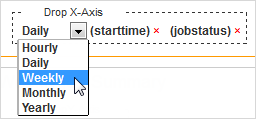
Select an option for the type of aggregate information that you want to display for each field name in the chart.
Options vary based on the type of field that you select.
-
You can drop multiple field names into the Drop X-Axis and Drop Y-Axis box to plot additional information in the chart.
-
Optional: On the Properties tab, click General
 , and then configure any of the available options.
 -
Optional: On the Properties tab, click Fields
 , and then configure any of the available options.
 -
Optional: On the Properties tab, click Custom Code
 , and then configure any of the available options.
 -
Optional: On the Properties tab, click Filter
 , and then configure any of the available options.
 -
To save this version of your report specification in the Reports Manager, at the top of the Report Builder page, click Save.
-
To make the report available to end users on the Reports page, at the top of the page, click Deploy.